
How the Dashboard Charts are Populated
This article will explain how each chart on the dashboard is populated, and which factors makeup the overall totals.
Sales & Cost Trend
The sales and cost trend table is populated using the Gross Profit Ledger. Based on the period selected, this table will populate with the gross profit, grouped by months, which is calculated as gross profit = total sales - total purchase - total expense.
 The Gross Profit Ledger (found within reports) can be used to see a break down of these totals.
Top Suppliers
This graph retrieves all worksheets containing the selected supplier for the specified companies and calculates the total sum either by supplier (if “By Purchase” is selected) or by total weight (if “By Tons” is selected).


Top Customers
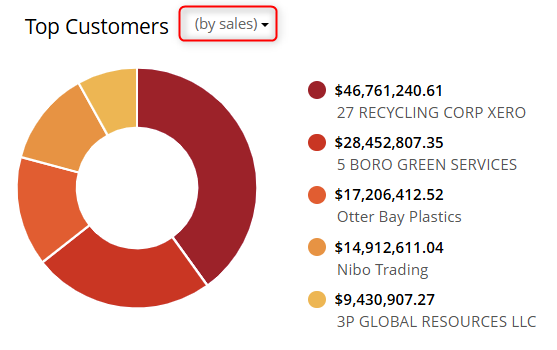
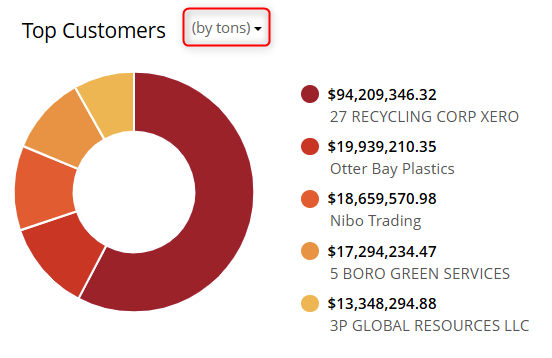
This graph retrieves all worksheets containing the selected customer for the specified companies and calculates the total sum of either Sales Amount + Freight Charges when “By Sales” is selected, or Total Weight when “By Tons” is selected.
 Aging Balance
 Aging Balance
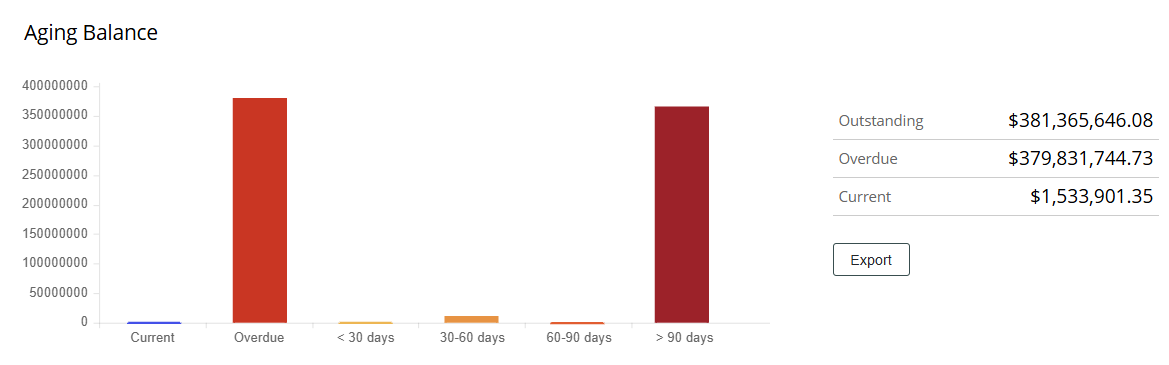
 This chart displays the total of all data points from the AR Aging Report, which is generated through the dashboard function. This version provides a summarized view of the report data.
 Tonnage Trend
 Tonnage Trend
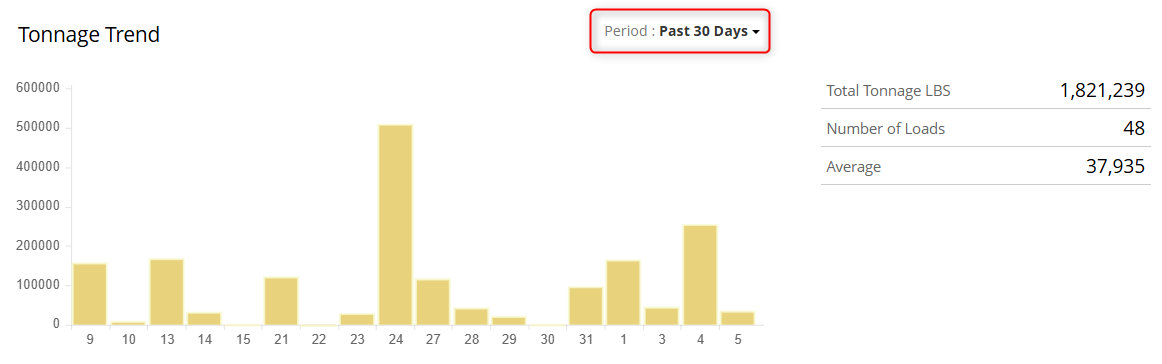
 Retrieves all entries from the GP Ledger report, sums the total weight values, and groups the results by month based on the selected period.
 Margin Trend
 Margin Trend
This graph retrieves all entries from the GP Ledger, calculates (Sales – Costs) / Sales, and multiplies the result by 100 to generate the data points for a chosen period.

Top Overdue Accounts
This also runs the AR Aging report and sums the overdue balance by the top 7 companies.

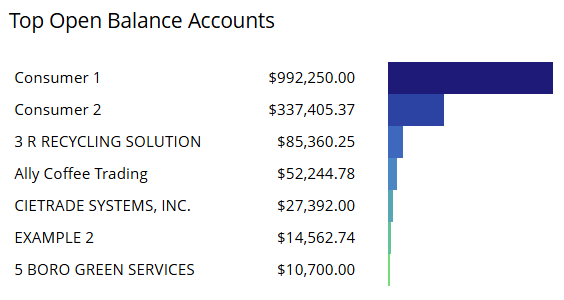
Top Open Balance Accounts
This also runs the AR Aging report and sums the current aging by the top 7 companies.
 Accrued Payables by Aging Periods
 Accrued Payables by Aging Periods
 This chart summarizes the amount fields from the Payables table, grouped by the Aging field.

If you have additional questions, please contact the Support Team via email to support@cietrade.net.