The Dashboard
The Dashboard is the first screen a user will see when they log into cieTrade. It is home to a number of graphics, all of which can provide you with a visual snapshot of how the company is doing overall. While the Dashboard provides a nice way to visualize how you're doing, we recommend using one of the standard reports within the system for a more granular breakdown. The standard reports (found within the Reports module) and inquiry screens are both viable options for your reporting needs.

Additional Information
Manage Reports
The Dashboard is entirely customizable. You have the ability to choose which graphics are shown, the order that they appear, and the default filters they will naturally use. All of this can be achieved by opening the Dashboard Settings.

Enable / Disable Reports
To hide a graphic from showing, simply open the Dashboard Settings and uncheck the box that correlates to the report.

Default Filters
To change the default filter of a graphic, open the Dashboard Settings, find the graphic you want to change, and update the default filter.

Rearrange Graphics
To change the order in which the graphics appear, open the Dashboard settings and use the six-dot icon to drag and drop the graphic in the position you want it to appear. 
Filter by Department
The graphics can be set to only show data for a particular department. To run the graphics by a selected department, navigate to the Dashboard Settings, and use the Department filter to make your selection.

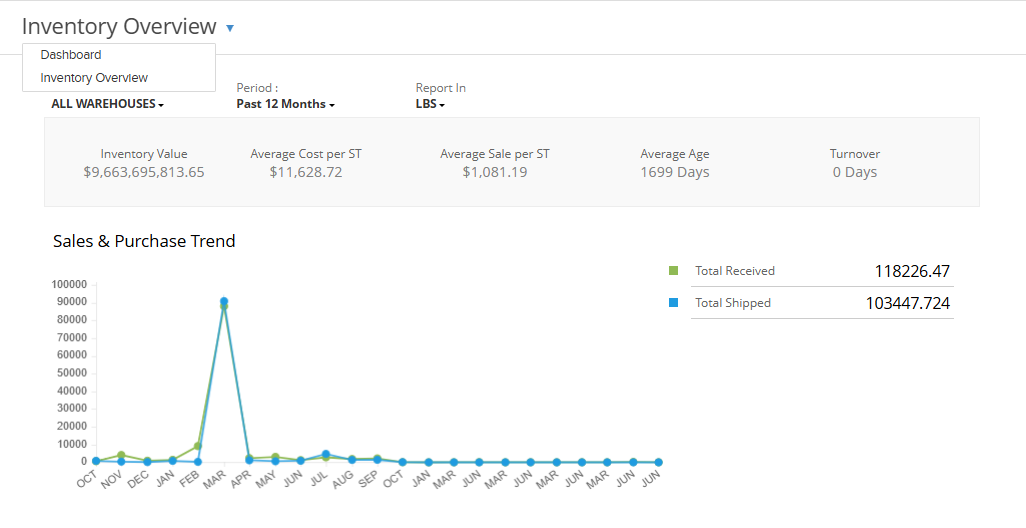
NOTE: if you have the inventory module enabled in your database, you also have the option to toggle to the Inventory Dashboard.
If you have additional questions, please contact the Support Team via email, to support@cietrade.net